PyCharm is a leading IDE for developing python application. Among many features it has an intuitive and a very effective python debugging UX.
With the PyCharm debugger, it is possible to debug any Python code. You have done that without any problem hundreds of times.
Today you are writing tests (for pytest) and you want to debug some of your tests, while developing. So you setup a configuration to run pytest, and you are positively surprised a template is already available. You set a breakpoint. Optimistically, you click debug and expect the execution to break, but instead pytest runs and concludes.
Another scenario that might have happened, is that you’ve been debugging pytest code successfully with PyCharm. Today, when you setup your breakpoint and hit the debug button on the same configuration that you were using before to debug your pytest code didn’t work i.e. pytest concluded and displayed the results in the console.
What is happening?
One common reason why PyCharm debugger is not able to stop at breakpoints is that something else is using the tracing api (sys.settrace). In this case it is the coverage analysis of pytest. Pytest is trying to estimate code coveragee using pytest-cov extension that uses the tracing api sys.settrace that PyCharm debugger uses.
Pytest Coverage and PyCharm debugger do not work well together. There is an issue on pytest-cov repository on Github: https://github.com/pytest-dev/pytest-cov/issues/131 and a bug report on the PyCharm bug tracker: https://youtrack.jetbrains.com/issue/PY-20186, but there is no out-of-the-box solution in sight.
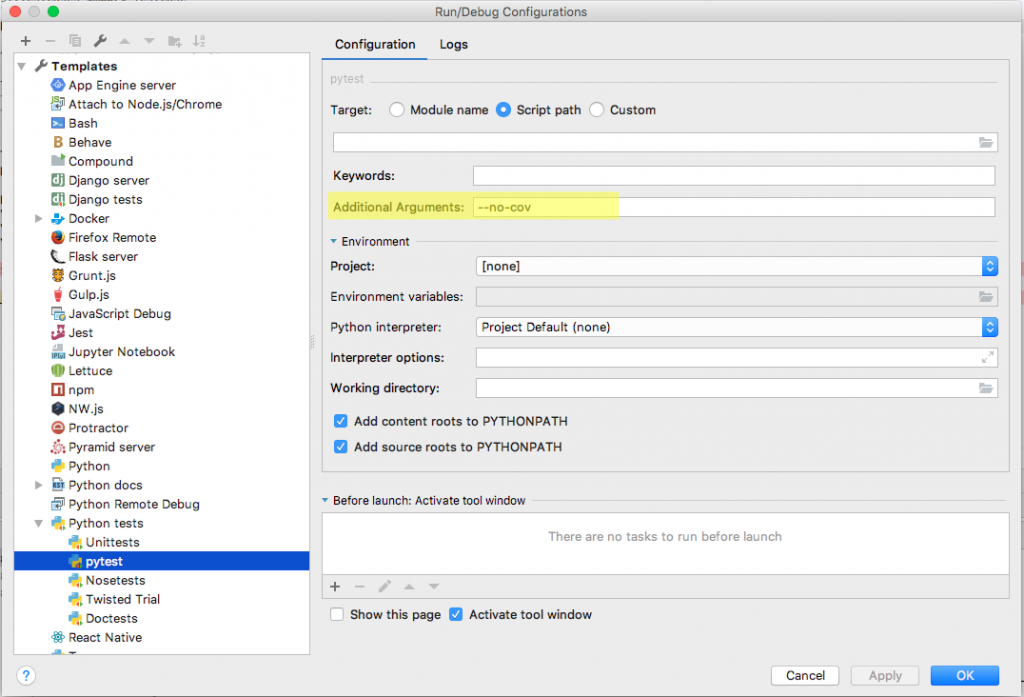
The best work-around that I found is to disable coverage when debugging, and here we can simply comment the –cov argument in the pytest.ini or even better to add the –no-cov argument to the PyCharm configuration, as shown in the following screenshot:

Happy debugging.
